Generalized quadratic interpolation
mathematics / engineering
I saw this result stated in an obscure forum circa 2016 (kudos to the dude who found it), but went ahead and wrote a proof for myself. Since then I used this method a few times to interpolate data found in old chemistry books, as nearest neighbor wouldn’t cut it in terms of precision for whatever I was doing back then.
Bilinear interpolation
Interpolating a function of two variables on a regular grid can be achieved thanks to bilinear interpolation. This technique is commonly used in computer graphics to resample textures, but is often refered to as bilinear filtering in this context. We’ll succinctly explore this interpolation method without going in too much detail. The goal of this section is to highlight a few equations that we need to generalize later on.
Let
Let
This system can be written in matrix form:
which we will denote this way:
and solved by matrix inversion. It can be shown that the following vector
where
Generalized quadratic interpolation
An optimization problem
If we don’t have a regular grid however, we can’t use bilinear interpolation anymore. Here I present a generalization of this method that works with arbitrary quadrilaterals, and admits bilinear interpolation as a special case.
Let
Note that when
This system can be written in matrix form:
which we will denote this way:
This linear system is underdetermined: there is an infinite number of ways to solve it. So let’s transform the problem a bit in order to find a particular solution with suitable properties. Say, for example, that we want to find the solution for which the quadratic coefficients are as small as possible. This is nice as it will ensure that
Solution
Solving
We can express this Lagrangian in terms of matrices. Let
Then solving
with
Thus,
So we recovered
This gives us a nice block matrix form:
The big block matrix on the left will be called numpy.linalg.
Implementation
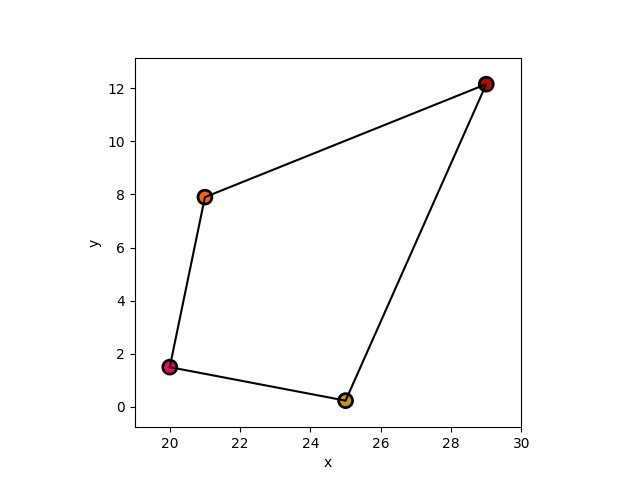
We’ll use the method described above to interpolate colors inside an arbitrary quad:

The implementation will be done in Python. We are going to use numpy for the linear algebra operations, matplotlib to plot things, and shapely to draw the quad.
import numpy as np
from matplotlib import pyplot as plt
from shapely.geometry import Polygon
The quadratic form
def qform(xx: float, yy: float):
    return np.array([np.power(xx, 2), xx*yy, np.power(yy, 2), xx, yy, 1.0])
For better stability, the values of
def normalize(X, Y, Z):
    xmin = np.min(X)
    ymin = np.min(Y)
    zmin = np.min(Z)
    Xn = X - xmin
    Yn = Y - ymin
    Zn = Z - zmin
    xmax = np.max(Xn)
    ymax = np.max(Yn)
    zmax = np.max(Zn)
    Xn /= xmax
    Yn /= ymax
    Zn /= zmax
    return (Xn, Yn, Zn, xmin, xmax, ymin, ymax, zmin, zmax)
We also define a function that takes any point and transforms it to the above normalized space:
def to_normalized_coord(X, Y, xmin, xmax, ymin, ymax):
    return ((X-xmin)/xmax, (Y-ymin)/ymax)
The extremal values of normalize() function. Then we can write a function that takes the quadrilateral and the values at its vertices, and returns an interpolant:
def quad_interpolation(XX, YY, ZZ):
    # Renormalize coordinates for better stability
    Xn, Yn, Zn, xmin, xmax, ymin, ymax, zmin, zmax = normalize(XX, YY, ZZ)

    # Value vector, 4 values for the Lagrange multipliers,
    # 6 zeros for stationary points where the Lagrangian vanishes
    b = np.append(Zn, np.zeros(6))

    # We now form the matrix A of the linear system to be solved
    E = np.diag([1, 1, 1, 0, 0, 0])
    X = np.array([qform(Xn[0], Yn[0]),
                  qform(Xn[1], Yn[1]),
                  qform(Xn[2], Yn[2]),
                  qform(Xn[3], Yn[3])])
    A = np.block([
        [X, np.zeros([4, 4])],
        [E, X.T]
    ])

    # And solve the linear system for the quadratic form coefficients
    a = np.linalg.lstsq(A, b)[0]

    # Return the interpolant
    def interp(xx, yy):
        # Transform xx and yy to normalized coordinate space
        xn, yn = to_normalized_coord(xx, yy, xmin, xmax, ymin, ymax)
        # Evaluate quadratic form and transform result to original value space
        return np.dot(a[0:6], qform(xn, yn)) * zmax + zmin

    return interp
Note that using a = np.linalg.solve(A, b) instead of a call to np.linalg.lstsq() does appear to work in most cases. Now, we code the main function. We calculate an interpolant for each color channel separately, and use them to interpolate the colors inside the quadrilateral.
def main(argv):
    # These are the point coordinates for which we know a value
    X = np.array([20, 21, 29, 25], dtype='float')
    Y = np.array([1.5, 7.9, 12.154, 0.238], dtype='float')

    # These are the RGB color values for each point
    r = np.array([1.0, 1.0, 0.8, 0.8], dtype='float')
    g = np.array([0.0, 0.4, 0.0, 0.6], dtype='float')
    b = np.array([0.4, 0.0, 0.0, 0.0], dtype='float')

    # Get an interpolant for each color channel
    r_interp = quad_interpolation(X, Y, r)
    g_interp = quad_interpolation(X, Y, g)
    b_interp = quad_interpolation(X, Y, b)

    # Plot stuff
    # Construct a mesh grid
    xmin = np.min(X)
    ymin = np.min(Y)
    xmax = np.max(X)
    ymax = np.max(Y)
    xls = np.linspace(xmin, xmax, 50)
    yls = np.linspace(ymin, ymax, 50)
    xv, yv = np.meshgrid(xls, yls)

    # Interpolate colors and clamp the results between 0 and 1
    r_int = np.clip(r_interp(xv, yv), 0, 1)
    g_int = np.clip(g_interp(xv, yv), 0, 1)
    b_int = np.clip(b_interp(xv, yv), 0, 1)
    C = np.dstack((r_int, g_int, b_int))

    # Plot the quadrilateral itself
    poly = Polygon(np.dstack((X, Y))[0])
    poly_x, poly_y = poly.exterior.xy

    fig = plt.figure()
    ax = fig.add_subplot(111)
    ax.plot(poly_x, poly_y, color='black')

    # Plot each known point as a colored disk
    ax.scatter(X, Y, color=np.dstack((r, g, b))[
        0], edgecolor='black', linewidth=2, s=100)

    # Display interpolated colors as an image
    ax.imshow(C, extent=[xmin, xmax, ymin, ymax], origin='lower')
    ax.set_aspect(1.0/ax.get_data_ratio(), adjustable='box')
    plt.xlim(xmin-1, xmax+1)
    plt.ylim(ymin-1, ymax+1)
    plt.xlabel('x')
    plt.ylabel('y')
    plt.show()
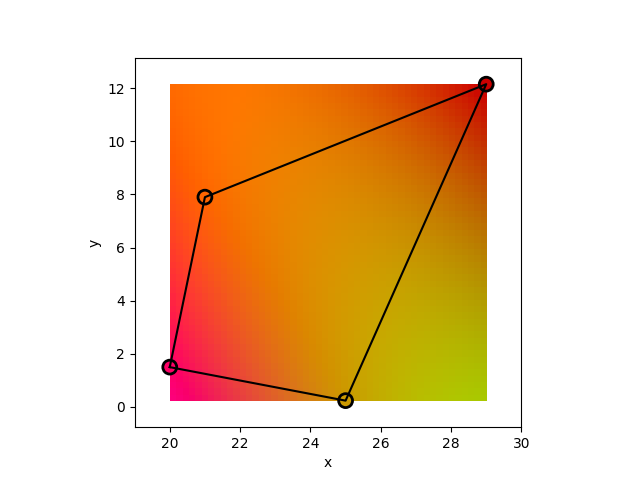
This should produce the following figure:

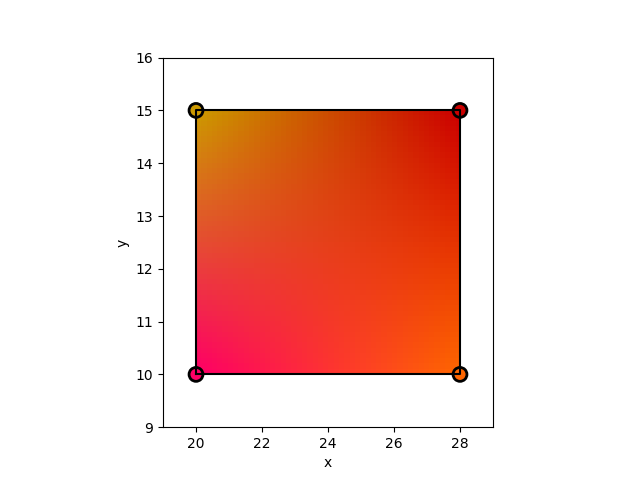
This method works as expected, and gives a smooth result. It is of non negligible interest that, to a certain extent, it can be used to extrapolate the colors outside the quadrilateral as well. Now, to verify our previous claim that when the input quadrilateral is a rectangle, the interpolant would degenerate to the bilinear case, we simply change the values in the X and Y arrays, and repeat the experiment:
    X = np.array([20, 28, 28, 20], dtype='float')
    Y = np.array([10, 10, 15, 15], dtype='float')

Here are the coefficient vectors
[-1.052e-16  4.996e-16  2.567e-16 -9.853e-16 -1.000e+00  1.000e+00 -4.441e-16  7.910e-16 -7.216e-16  8.743e-16]
[-9.600e-16 -1.667e+00 -5.551e-17  6.667e-01  1.000e+00  7.772e-16 1.667e+00 -1.667e+00  1.667e+00 -1.667e+00]
[ 3.814e-16  1.000e+00  1.943e-16 -1.000e+00 -1.000e+00  1.000e+00 -1.000e+00  1.000e+00 -1.000e+00  1.000e+00]
I’m convinced that the same scheme can be applied to extend a bicubic interpolation too. Have you used something like that before?
 Orange Wire